One of the City's goals is to increase mobility within our community. This includes targets for increasing the convenience of mass transit, improving walkability, making cycling easier and increasing the occupancy of motor vehicles. Shifting to more active transportation as an alternative to vehicle travel is also one of the most important ways we can reduce our climate impact.
Tracking how many passenger vehicles are registered to Colwood residents and whether that number is increasing or decreasing is one measure that will help us understand mobility and commuting habits to inform transportation planning, including parking standards and other related policies.
Understanding vehicle data helps the City to:
- develop transportation plans
- plan road improvements
- evaluate parking requirements
- plan for people with mobility challenges, bicycle commuters, transit users, carpool and ride-sharers, and many other groups
- understand travel habits
- evaluate air pollution and climate impacts
Colwood Annual Passenger Vehicle Census
| Year | Population Estimate | Number of Dwellings | Avg Household Size | Median After Tax Income of Households |
|---|---|---|---|---|
| 2015 | 17,110 | 5,535 | ||
| 2016 | 17,665 | 5,635 | ||
| 2017 | 17,920 | 5,799 | ||
| 2018 | 18,186 | 5,894 | ||
| 2019 | 18,907 | 6,042 | ||
| 2020 | 19,379 | 6,867 | ||
| 2021 | 19,693 | 7,688 | 2.5 | 89,000 |
| 2022 |
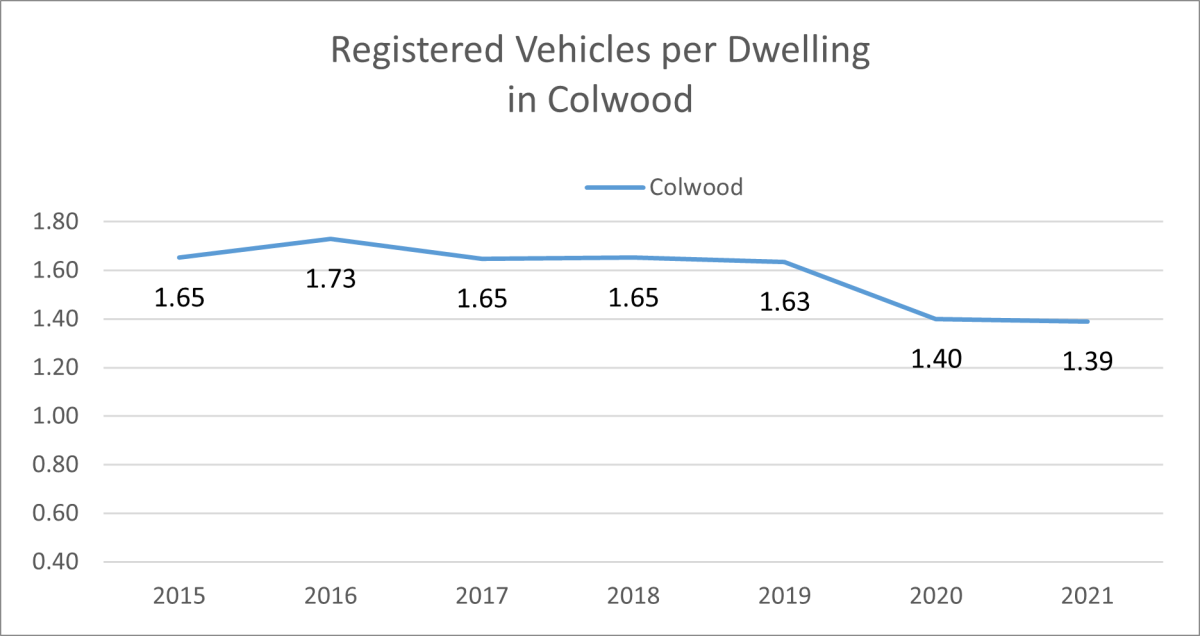
| Year | Number of Passenger Vehicles | Year to Year Change | Vehicles per Capita | Vehicles per Dwelling |
|---|---|---|---|---|
| 2015 | 9145 | 0.53 | 1.65 | |
| 2016 | 9748 | 603 | 0.55 | 1.73 |
| 2017 | 9559 | -189 | 0.53 | 1.65 |
| 2018 | 9736 | 177 | 0.54 | 1.65 |
| 2019 | 9877 | 141 | 0.52 | 1.63 |
| 2020 | 9615 | -262 | 0.50 | 1.40 |
| 2021 | 10,683 | 1068 | 0.54 | 1.39 |
| 2022 |
| Year | Electric Vehicles | EV per Capital | EV per Dwelling |
|---|---|---|---|
| 2015 | 34 | 0.002 | 0.006 |
| 2016 | 45 | 0.003 | 0.008 |
| 2017 | 74 | 0.004 | 0.013 |
| 2018 | 95 | 0.005 | 0.016 |
| 2019 | 167 | 0.009 | 0.028 |
| 2020 | 179 | 0.009 | 0.026 |
| 2021 | 208 | 0.011 | 0.027 |
| 2022 |
Note: Commercial vehicles are not included in these calculations as the focus of this data is to help the City understand trends related to commuting habits and street parking to inform transportation and transit planning.